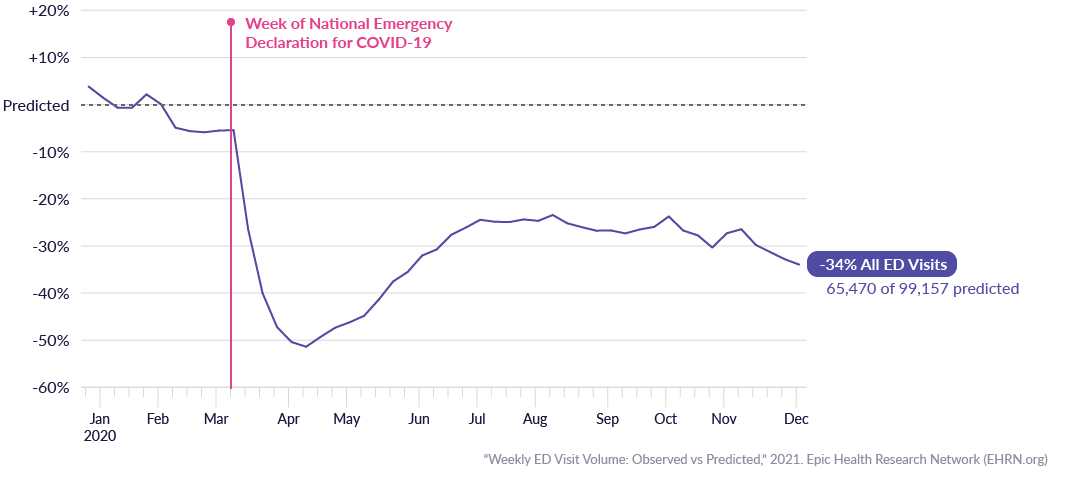
Research by the CDC’s National Syndromic Surveillance Program and Jeffery et al. showed a substantial drop in ED visit volume at the onset of the COVID-19 pandemic.1,2 Anecdotal evidence suggested that patients with urgent conditions were not seeking care for fear of COVID-19 exposure or wanting to limit burden on the healthcare system.3 In our data, weekly ED visits dropped as low as 50% of predicted visit volume and have since only recovered to approximately 75% of predicted volume. While visit volume declined, the character of the remaining ED visits also changed. The patients who did present to the ED tended to have higher acuity problems (e.g., more likely to result in serious harm or death without attention). The average presentation of all types of problems was also more severe resulting in higher hospital admission rates. We theorize this shift is because patients with less severe presentations, regardless of acuity, appeared less likely to present to the ED during the pandemic.
We analyzed weekly ED visit volume from January 1, 2017 to December 12, 2020, involving patients who had either been discharged or died by January 10, 2021. We characterized the change in ED visit volume during the pandemic using a generalized additive model combining long-term, seasonal, and holiday effects. We then examined changes in predicted and observed rates of hospital admissions from ED visits and then narrowed in on ED visits with a diagnosis of stroke, acute myocardial infarction (AMI), dermatitis, or conjunctivitis. In our analysis, stroke and AMI were used to represent higher acuity diagnoses while conjunctivitis and dermatitis were used as examples of lower acuity diagnoses.
The most pronounced drop in visit volume happened from March-May 2020 following the national emergency declaration (Figure 1), and although visit volumes rebounded somewhat over the summer, they remained approximately 30% lower than model prediction through the second half of 2020.
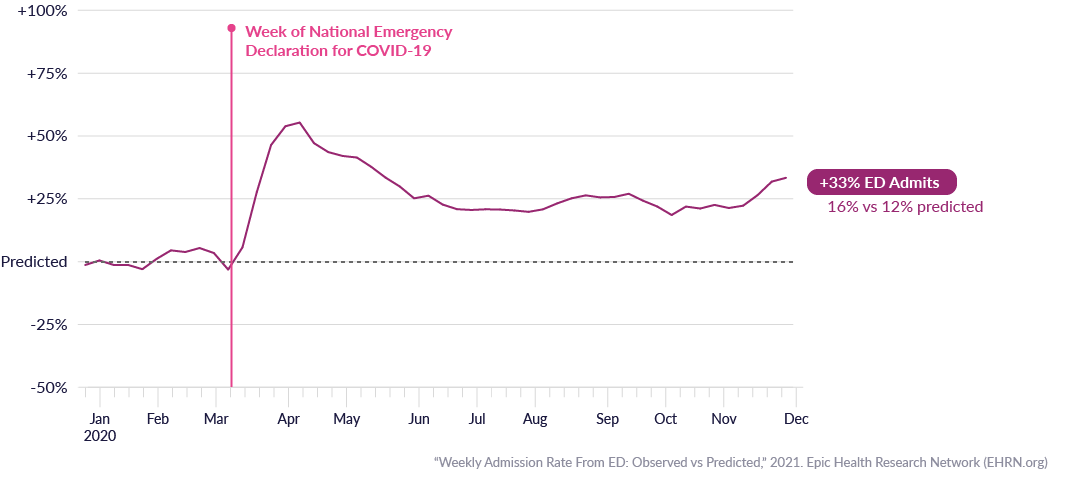
With this overall drop in ED visit volumes, we wanted to characterize ED utilization during the pandemic. Focusing on admission rates from the ED before the national emergency declaration, we observed an average of 12-13% of ED visits admitted for inpatient care. In contrast, the hospital admission rate from ED visits spiked to 19% in April 2020, which is 55% above the predicted rate (Figure 2). In the second half of 2020, the admission rate hovered around 15-16%, which remains 20-30% higher than predicted.
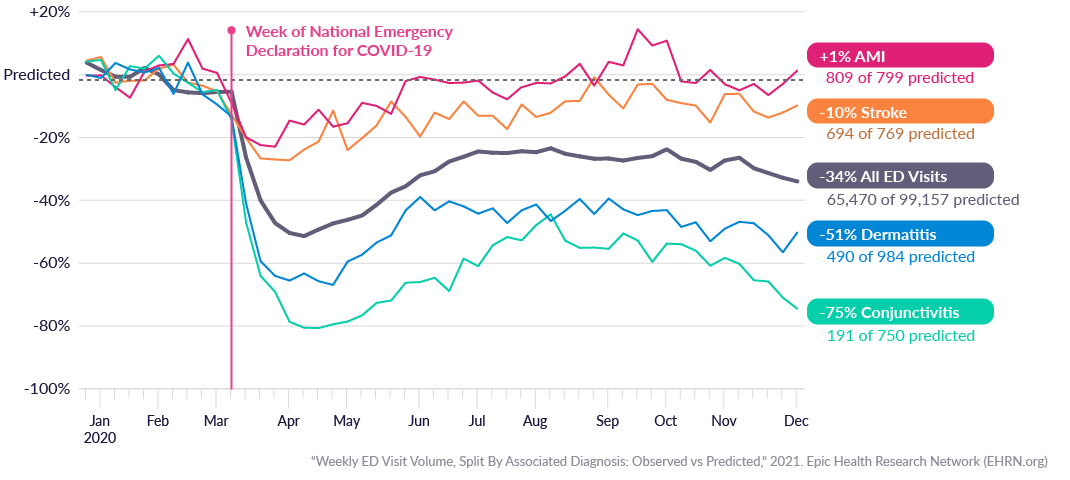
With decreased emergency visits and increased rates of hospital admission, we investigated whether patients with less severe medical needs may not be presenting for care. Stroke and AMI were used as examples of high acuity diagnoses that generally require emergent attention to minimize harm and frequently result in admissions due to greater severity, while dermatitis and conjunctivitis were selected to represent low acuity conditions that typically do not require immediate care and are less likely to result in admissions due to lower severity of illness. The number of visits for AMI and stroke initially dropped as low as 77% and 73% below the predicted volume, respectively. By summer 2020, ED visits for AMI and stroke were climbing back closer to normal levels. Conversely, ED visits for dermatitis and conjunctivitis dropped even more than overall ED visit volume (as low as 34% and 19% of predicted volumes, respectively) and remain at roughly 50% and 25% of predicted visits, respectively (Figure 3). These patterns of ED visit volume for high and low acuity diagnoses suggest that patients with less severe illnesses are not utilizing the ED at pre-pandemic rates, and as a result the overall acuity of ED visits during the pandemic has risen.
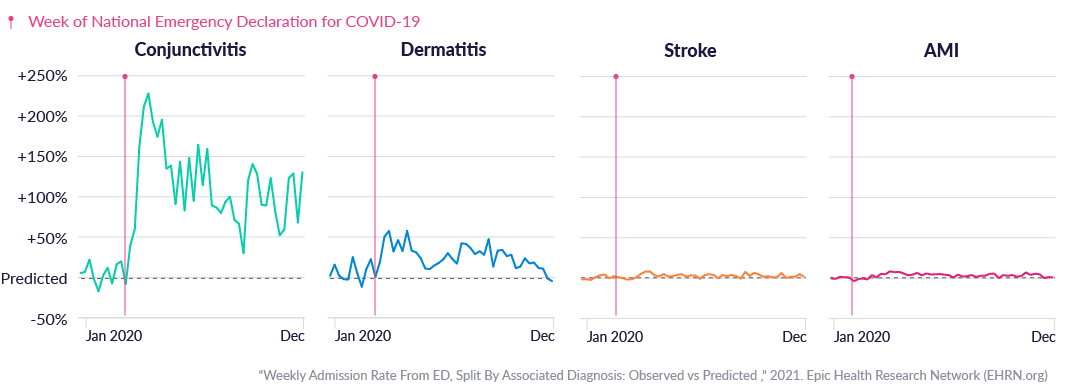
We also examined the admission rates for patients with each of the four diagnoses and found that patients were admitted at higher rates than predicted (Figure 4). However, patients with the higher acuity diagnoses had only a slight increase in admission rates; stroke and AMI were previously admitted at 79% and 83% respectively, and in April 2020 these rates rose to 83% and 89%. Patients with conjunctivitis and dermatitis diagnoses were previously admitted at average rates of 6% and 15% respectively, and in April 2020 this jumped to 16% and 27%. This suggests that, regardless of diagnosis, the average presentation of these problems to the ED during the pandemic was more severe (i.e., more likely to result in admission). This shift in average presentation may be due in part to people with milder cases of these problems not coming to EDs for care. This effect was most pronounced in diagnoses that are typically thought of as lower acuity.
Our results suggest that, although ED visits have dropped over the course of the pandemic, the types of problems seen in the ED have tended towards higher acuity diagnoses. Moreover, the individual problems we examined resulted in a higher percentage of admissions than in previous years. Patients with lower acuity conditions (e.g., dermatitis and conjunctivitis, as studied here) may be seeking care at non-emergency facilities or choosing to forgo treatment. Assuming these conditions are representative, it suggests that when patients with traditionally lower acuity diagnoses do present to the ED, these patients are more likely to be severely ill enough to require admission. In contrast, patients with higher acuity conditions appear to have continued seeking care at the ED when compared to ED visits overall, both initially and throughout the pandemic, and they are being admitted at close to the same rates as before the pandemic.


